Google Analytics 4 (GA4) provides powerful tools to help you understand how users interact with your website or app. This beginner’s guide will walk you through the basics of analysing user behaviour in GA4, helping you make the most of the data collected through event tracking.
What is user behaviour analysis?
User behaviour analysis involves studying how visitors interact with your website or app. By understanding these interactions, you can identify areas for improvement, optimise user experience, and make informed decisions to enhance your digital strategy. This process includes tracking various user actions, such as page views, clicks, form submissions, and navigation paths.
Benefits of understanding user behaviour
- Enhanced user experience: By knowing how users navigate your site, you can make adjustments to improve their experience. For example, if you notice that users frequently abandon the checkout process at a specific step, you can investigate and address potential issues, such as a confusing form field or slow page load times.
- Increased conversions: Identifying and addressing friction points can lead to higher conversion rates. For instance, if users are dropping off after adding items to their cart but before completing the purchase, you might simplify the checkout process or offer a discount to encourage completion.
- Informed decision-making: Data-driven insights allow you to make strategic decisions that align with user preferences and behaviours. This could involve adjusting your content strategy based on the types of articles that receive the most engagement or tailoring your marketing campaigns to target demographics that are most likely to convert.
Getting started with GA4
Accessing GA4
- Log in to Google Analytics: Visit the Google Analytics website and sign in with your Google account.
- Select your property: Choose the appropriate GA4 property from your account. If you don’t have a GA4 property yet, you will need to create one by following the setup wizard.
Setting up basic tracking
- Implement the GA4 tracking code: Ensure that the GA4 tracking code is properly installed on your website or app to start collecting data. This typically involves adding a small piece of JavaScript to your site’s header or using a tag management system like Google Tag Manager.
- Enable enhanced measurement: This feature automatically tracks common user interactions like scrolls, outbound clicks, site search, video engagement, and file downloads. To enable enhanced measurement, go to the “Data Streams” section in your GA4 property, select your web data stream, and toggle the enhanced measurement options.
Analysing user behaviour in GA4
Using the GA4 interface
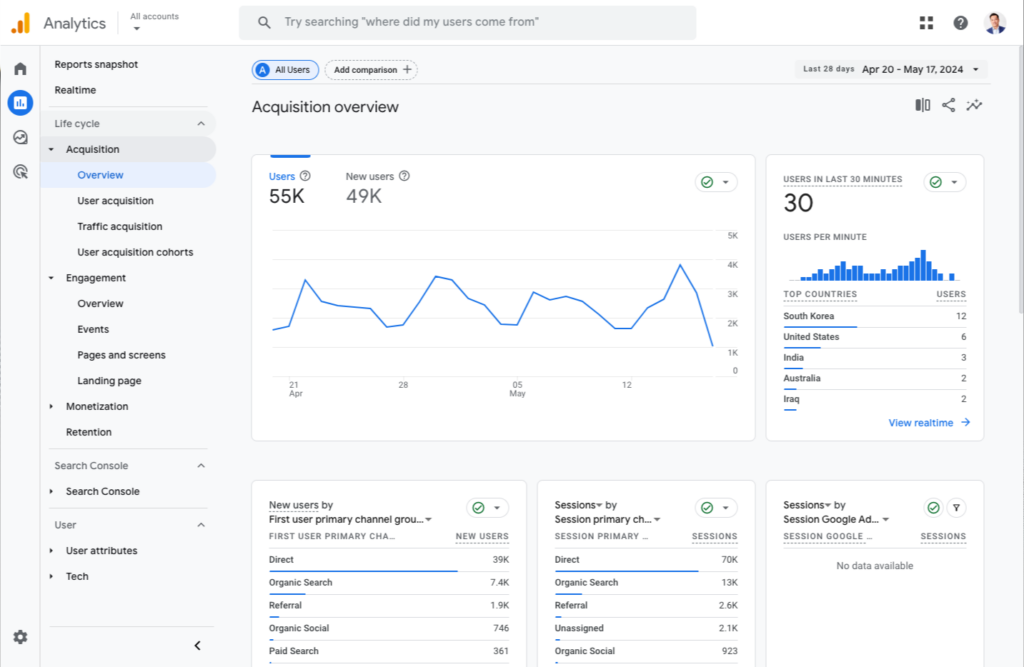
- Navigate to reports: In the GA4 interface, go to the “Reports” section to access various types of data about your users. The interface is designed to provide a comprehensive overview of user interactions, with predefined reports that cover key metrics and dimensions.
- Explore the different reports: Familiarise yourself with key reports such as “Realtime,” “Life Cycle,” and “User” reports. Each report type offers unique insights that can help you understand different aspects of user behaviour.
Key reports to understand user behaviour
- Realtime report: Monitor user activity as it happens, which is useful for checking the immediate impact of new content or marketing campaigns. For example, if you launch a new product, the Realtime report can show you how users are interacting with the product page in real-time.
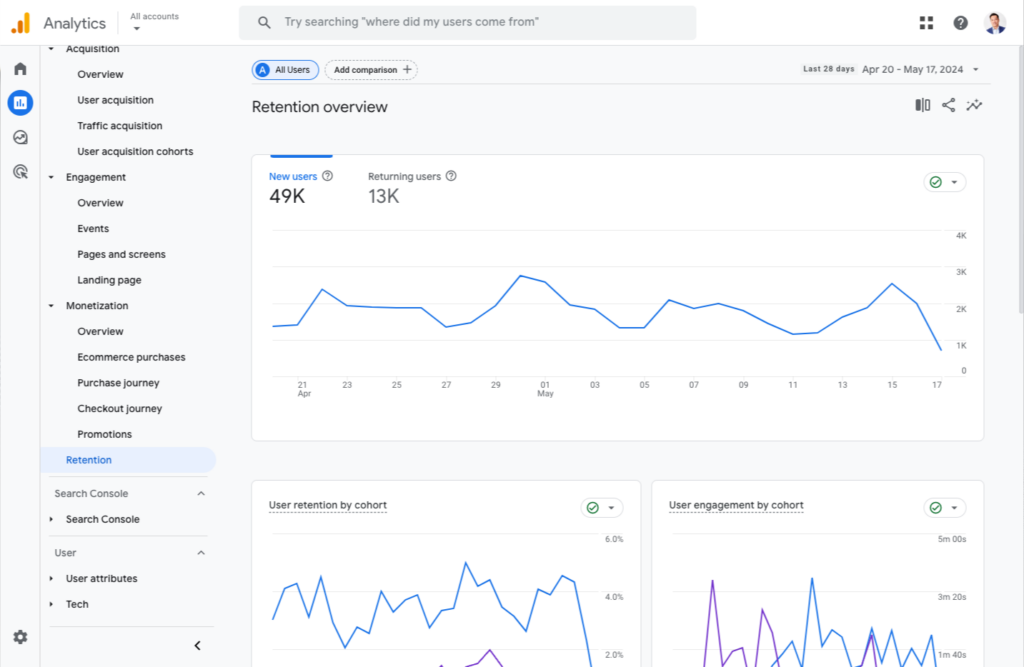
- Life Cycle reports: These reports provide insights into the user journey from acquisition to retention. They include sections like “Acquisition,” “Engagement,” “Monetisation,” and “Retention,” each offering detailed metrics about how users are acquired, how they interact with your site, how they convert, and how often they return.
Acquisition reports
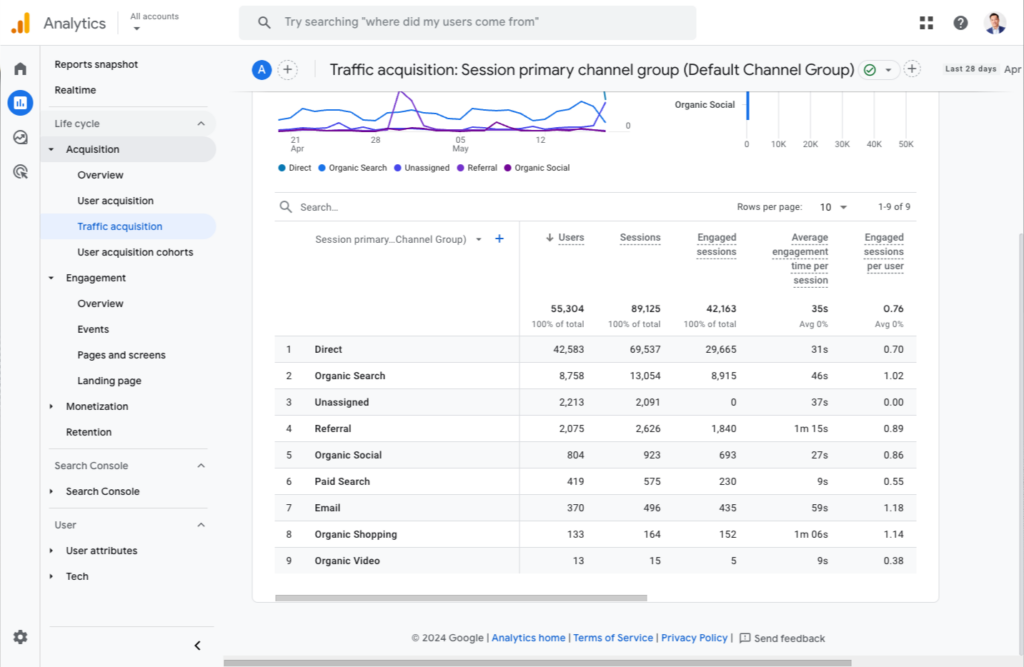
- Understanding traffic sources: These reports show where your users are coming from, such as organic search, paid search, social media, or direct visits. By analysing this data, you can determine which channels are most effective at driving traffic to your site.
- Campaign performance: Track the effectiveness of your marketing campaigns by seeing how different traffic sources contribute to user acquisition. For example, you can compare the performance of email marketing campaigns against social media ads to see which generates more engaged users.
Engagement reports
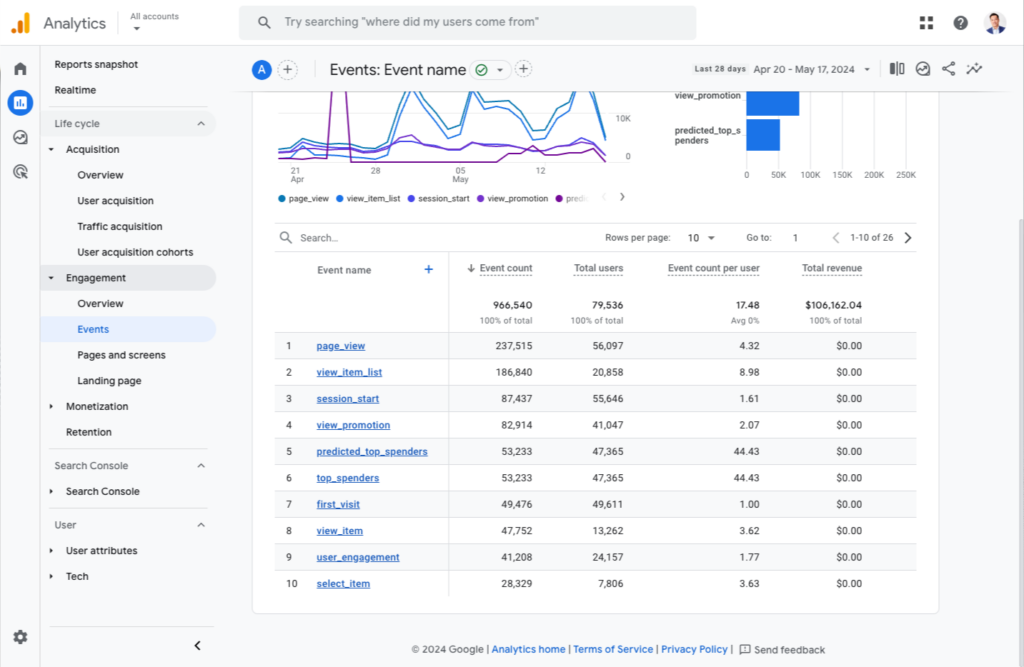
- User engagement metrics: Metrics such as average engagement time per session, pages per session, and engagement rate help you understand how users interact with your site. Higher engagement often correlates with more valuable content and a better user experience.
- Event tracking: Review data on specific user actions captured through event tracking, such as clicks, form submissions, and video plays. This helps you understand what users are doing on your site and which actions are most common.
Monetisation reports
- Revenue tracking: For e-commerce sites, these reports provide insights into revenue generated from different products, categories, and user segments. This helps you identify high-performing products and understand purchasing patterns.
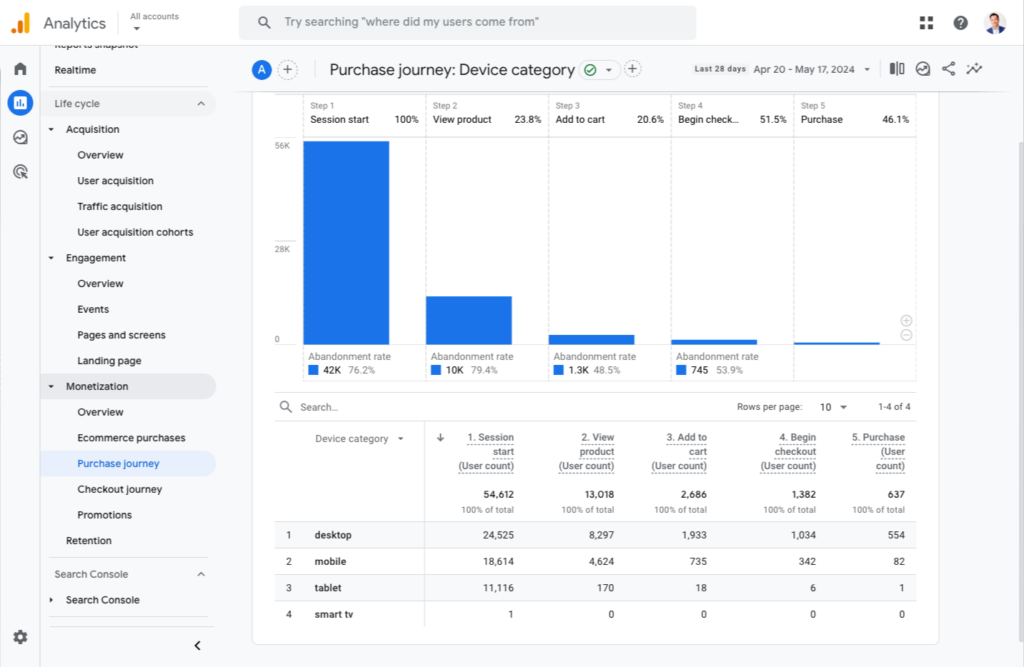
- Purchase funnel analysis: Analyse the steps users take from adding a product to their cart to completing the purchase. Identifying where users drop off in the funnel can help you optimise the checkout process and increase conversion rates.
Retention reports
- User retention: These reports show how often users return to your site over a specific period. High retention rates indicate that users find value in your content or services, while low retention rates may suggest a need for improvement.
- Cohort analysis: Group users based on shared characteristics or behaviours and analyse their interactions over time. This can help you understand how different user segments behave and how retention strategies impact different groups.
Audience insights
- Demographics: Understand the age, gender, and interests of your users to tailor your content and marketing efforts. For example, if your audience skews younger, you might focus on social media marketing and mobile-friendly content.
- Geolocation: Identify where your users are coming from geographically to optimise for different regions. For instance, if a significant portion of your traffic comes from a specific country, you might consider localising your content or running region-specific promotions.
Behaviour insights
- Engagement metrics: Track metrics like average engagement time, engaged sessions, and engagement rate to gauge how users interact with your site or app. This helps you identify content that resonates with your audience and areas that may need improvement.
- Events report: Review data on specific user actions captured through event tracking, such as clicks, form submissions, and video plays. Understanding these interactions can help you optimise your site for better performance and user satisfaction.
Applying insights to improve user experience
Optimising site navigation
- Identify drop-off points: Use behaviour flow analysis to see where users are exiting and improve those areas to retain visitors. For example, if users frequently leave your site from a particular page, you might investigate why that page isn’t engaging or provide more compelling calls to action.
- Simplify the user journey: Make it easier for users to find what they are looking for by optimising navigation menus and internal linking. Clear, intuitive navigation helps users find information quickly, reducing frustration and increasing the likelihood of conversion.
Enhancing content strategy
- Analyse content performance: Determine which pages and content types are most engaging and replicate their success. For example, if blog posts on certain topics receive high engagement, you might create more content on those topics.
- Personalise content: Use demographic and behaviour data to personalise content for different user segments. Personalised content can increase engagement by addressing the specific interests and needs of different audience groups.
Improving conversion rates
- Identify and fix bottlenecks: Use funnel analysis to find and address obstacles in the conversion process. For example, if users frequently abandon their carts at the payment stage, you might simplify the payment process or offer additional payment options.
- A/B testing: Experiment with different versions of your site elements to see which ones perform better and implement the most effective changes. A/B testing can help you optimise various aspects of your site, from headlines and images to call-to-action buttons and page layouts.
Conclusion
Understanding user behaviour with Google Analytics 4 (GA4) allows you to make data-driven decisions that enhance user experience, increase conversions, and optimise your digital strategy. By setting up basic tracking, exploring key reports, and applying the insights gained, you can significantly improve how users interact with your website or app.
Event tracking in GA4 not only enhances your understanding of user behaviour but also arms you with data to make strategic adjustments that can lead to better user experiences and increased conversions. When set up correctly, it provides a granular view of how users interact with various elements of your site or app, from clicking on a specific button to how far they scroll down a page. For example, a digital publisher might track how often readers click the “expand” button on a collapsible content section to determine if readers find that information valuable.
Beyond individual page interactions, event tracking in GA4 is pivotal for understanding the performance of different channels that lead users to your site. For instance, by tracking events that originate from different sources—such as social media, email campaigns, or search engines—you can gauge which channels are most effective at driving valuable user actions. For example, an e-commerce site could track which ads lead to the most product views or purchases, providing clear data on which ads to prioritise or revise.
Furthermore, event tracking data can be leveraged to enhance automated marketing efforts. By integrating GA4 with marketing automation tools, businesses can create more targeted, behaviour-driven campaigns. For example, if a user watches a video on a product page but doesn’t make a purchase, you could automatically trigger a follow-up email with additional information or a special offer to encourage conversion. This strategic use of behaviour data helps in nurturing leads and moving potential customers through the sales funnel more efficiently.
In summary, the capabilities of GA4’s event tracking can transform how businesses interact with their users, providing insights that lead


